Introduction
The ‘green economy’ and the promotion of Gender Equality are at the top of the EU R&I policy agenda. The participation of women in the application and use of scientific outputs can build gender perspectives and analyses into (technology) innovation processes. One method that can be used to monitor the participation of women in innovation processes is to look at the gender of inventors of patents. The periodic She Figures reports provide a summary of women’s contribution to patents at the level of countries, for example.
An avenue for monitoring participation of women inventors in responsible innovation is through an analysis of their contributions to Green Technology patents. These data and indicators refer to patterns of (largely) private sector innovation.
Women inventors in Green Technology
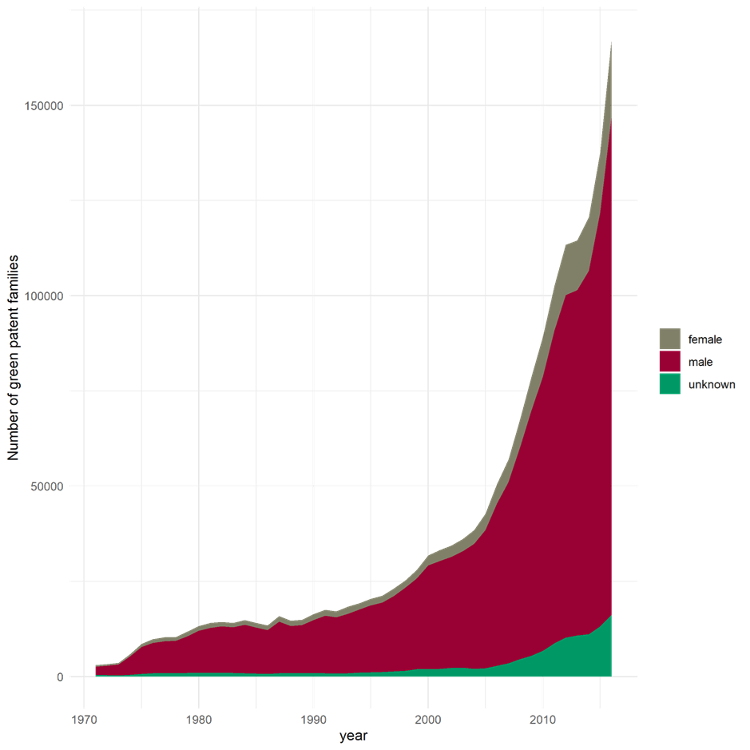
The number of women inventors in green technology patenting has been rising strongly since around 1995 and has accelerated markedly since 2005.
Gender of inventors, Y02 patent families
To understand the participation of women inventors in green technology innovation we can calculate the ratio of women inventors on CPC Y02 class patents. This ration can also be calculated for each of the eight technology sub-fields within the Y02 classification.
Ratio of women inventors, by technology fields, Y02 patents 1971-2016
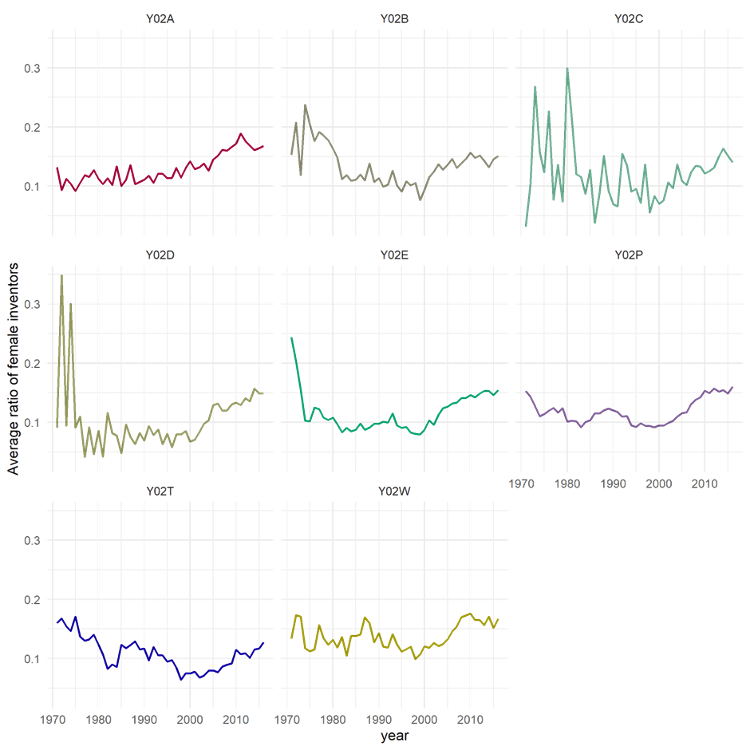
The ratio of female inventors is calculated by dividing the total number of women inventors, using a fractional count, into the total number of inventors (women plus men). The ratio of women inventors has been rising in all green technology sub-fields, particularly since 2000. This growth rate of this ratio can be described as moderate and steady.
Geography of women inventors in Green Technologies
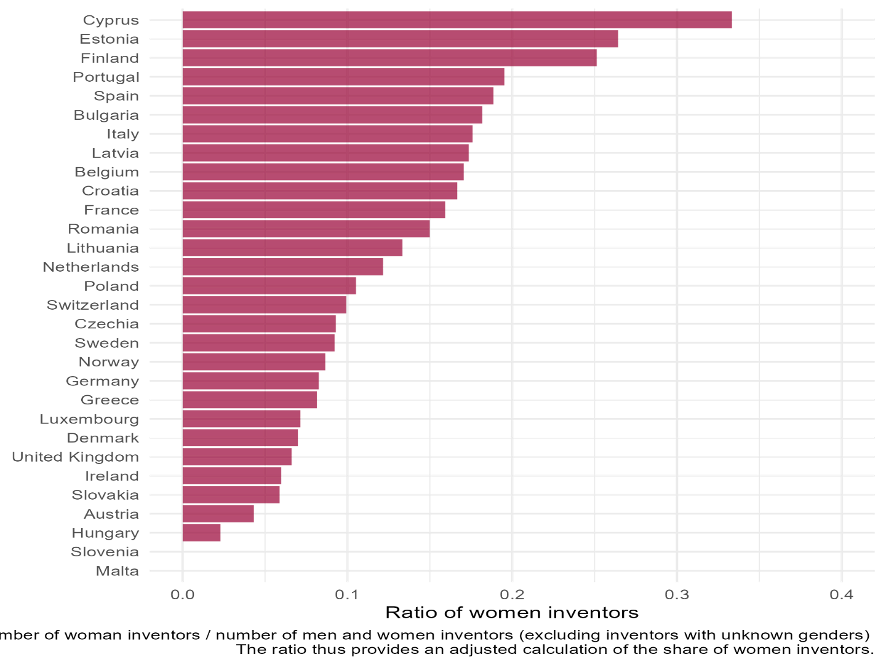
In Europe, the highest ratios of women inventors of Green Technology patents can be found in a number of smaller countries. Some of the countries may have quite small numbers of green patents in a single-year snapshot, so it is advisable to also look at these results when sorted by number of patents overall, or normalising for the size of the R&D workforce for example.
Among larger countries, Spain and Italy had relatively high ratios in 2017. Among the larges producers of Green Technology patents, Germany and the UK had relatively lower ratios of women inventors.
Ratio of women inventors, by country, 2017
The ratio of women inventors of Green Technologies can be explored along different dimensions. Data are available by Country (EU-27 plus Norway, Switzerland, and the UK), for each technology field (Y02 sub-codes). These data are available for all years for the period 2006-2017 inclusive.
The size of the population, economy, and industrial base of European countries is enormously varied. In comparing data on green patenting activities in different countries it is advisable to go beyond the simple number of patent families produced. The production of green patents can be ‘normalised’ by population and by R&D expenditure levels, for example. Ratios can also be sorted by the numbers of patents. Using these tools can help produce a more informed perspective on the growth of responsible innovation efforts across Europe.
A range of visualisations and downloads about women inventors in Green Technology fields are available for exploration on the PROMISE Dashboard