Responsible Innovation
Introduction
Monitoring the innovation face of R&I helps us understand how the outputs of research are being used to make a difference in the world. The most common type of data that is used to understand the dynamics of innovation is patent data. Patents represent a particular invention, usually based in the application of science and technology, and seek to restrict ownership and the right to commercially exploit that invention for a specified period. Patents are thus the basis of the intellectual property regime that shapes technology fields and industries. Typically, patents represent the innovation activities of Business Enterprises, although not exclusively so.
Monitoring responsible innovation presents other challenges. How can we know if a particular invention is responsible? Is it possible to understand whether open science or citizen science played a part in the design and development of an invention? One way is to look at those inventions focused on making a difference in areas of challenges that affect populations and society. To look at responsible innovation we can thus use patents for the development of ‘green technologies’.
What are Green Technologies?
What we term ‘green’ technology innovations are inventions related to climate change adaptation and mitigation technologies (CCMTs). Under the cooperative patent classification (CPC) coding scheme, green technologies are allocated to the Y02 CPC code. Within the Y02 classification there are eight sub-codes. These green sub-codes are addressed to challenges such as clean energy, CO2 reduction, or cleaner production and transport processes.
Relevant ‘patent families’ are categorised under an appropriate sub-code. A patent family is a “set of either patent applications or publications taken in multiple countries to protect a single invention by a common inventor (s) and then patented in more than one country. A first application is made in one country – the priority – and is then extended to other offices” (source: EPO.org). The different technology areas associated with each code are described in the table, which also shows the total number of patent families for each area for the period 1971-2016.
CPC Y02 sub-codes | Description | Patent families (N) |
Y02A | Technologies for adaptation to climate change | 226011.103 |
Y02B | Climate change mitigation technologies (CCMTs) related to buildings, e.g. housing, house appliances or related end-user applications | 162510.279 |
Y02C | Capture, storage, sequestration or disposal of greenhouse gases [GhG] | 7762.178 |
Y02D | CCMTs in information and communication technologies [ICT], i.e. information and communication technologies aiming at the reduction of their own energy use | 73831.546 |
Y02E | Reduction of greenhouse gas [ghg] emissions, related to energy generation, transmission or distribution | 492671.436 |
Y02P | CCMTs in the production or processing of goods | 423804.190 |
Y02T | CCMTs related to transportation | 320036.985 |
Y02W | CCMTs related to wastewater treatment or waste management | 200345.732 |
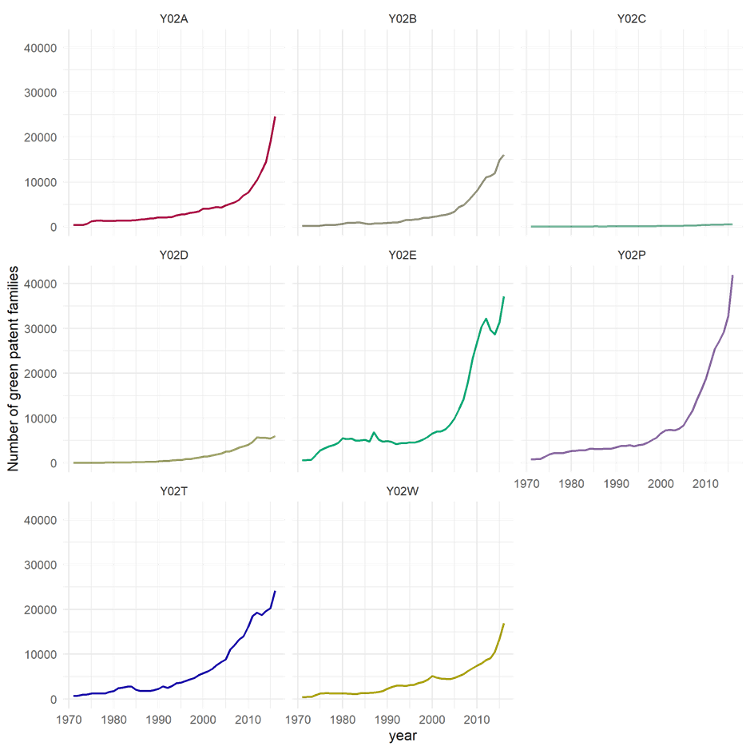
Growth in Green Technology innovation
The numbers of patent families in many of these different technology areas has been rising rapidly in recent years. This is particularly the case in relation to climate change adaptation (Y02A), reduction in greenhouse gas emissions (Y02E), production processes (Y02P) and transport (Y02T).
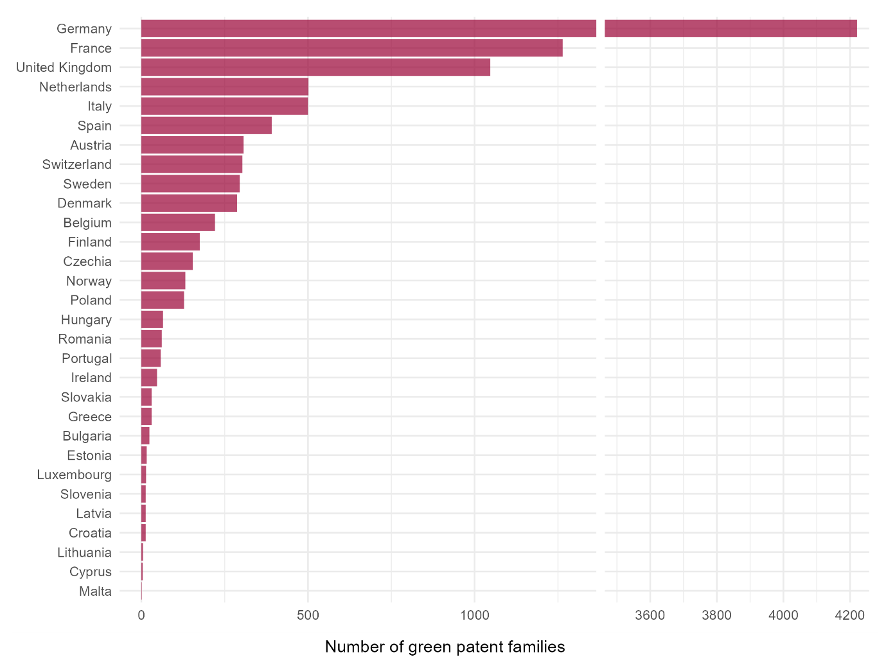
Geography of Green Technology innovation
In Europe, the largest numbers of Green Technology patents are produced in Germany, France, and the UK. Among smaller countries, the Benelux and Scandinavian countries are prominent producers of green technology patents.
Green technology patent families, by country 2017
Green Technology patent data can be explored along different dimensions. Data are available by Country (EU-27 plus Norway, Switzerland, and the UK), for each technology field (Y02 sub-codes). These data are available for all years for the period 2006-2017 inclusive.
The size of the population, economy, and industrial base of European countries is enormously varied. In comparing data on green patenting activities in different countries it is advisable to go beyond the simple number of patent families produced. The production of green patents can be ‘normalised’ by population and by R&D expenditure levels, for example. Using these tools can help produce a more informed perspective on the growth of responsible innovation efforts across Europe.
A range of visualisations and downloads of Green Technology patent data and are available for exploration on the PROMISE Dashboard.